
Make your data accessible, actionable, and beautiful.
Data science for healthcare organizations and mission-driven teams that need rigorous analysis and plain-language results.

"Steph doesn't just run the analysis, she asks the questions that reframe the problem. Whether she's working with execs, clinicians, or engineers, she brings an unusually empathetic lens that makes even complex statistical concepts approachable and actionable."


Paul Wicks, PhD
CEO
ProofStack Health


Built with you,
not just for you.
You don't need someone to take your data and hand back a report that sits unread in your team's Google Drive for months because no one knows what to do with it. Good data work makes a question answerable, an answer actionable, and the path forward clearer.
That starts with someone who will:
Listen first
Design a plan with you
And ensure every deliverable is ready to use
"When we started, the data landscape seemed like a potentially insurmountable hurdle. In just three months, we had a clear architecture and roadmap that the entire organization bought into"
Thomas Lockney
Senior Director of Software Engineering
Metron
The best analysis starts with active listening, and a plan that fits your question, your data, and your team.
Services & Pricing
There Are 3 Ways You Can Work With Me

Advisor
A thinking partner for your data questions. Book a call when you need to brainstorm an approach, pressure-test a plan, or talk through results that don't quite make sense yet.
Perfect for: Teams that have the capacity but need a sounding board.
Rate: $300/1-hour consultation
Data Sprint
A finite and focused engagement designed around your specific goals. You walk away with answers, documentation, and enough momentum to take the next step without me.
Perfect for: The question that keeps coming up in leadership meetings.
Rate: Starting at $5,000
Ongoing Partnership
Some questions are bigger than a sprint. I join your team as a fractional data scientist, on retainer, for as long as you need me.
Perfect for: When the questions keep coming and the work keeps growing
Rate: Starting at $5,000/month


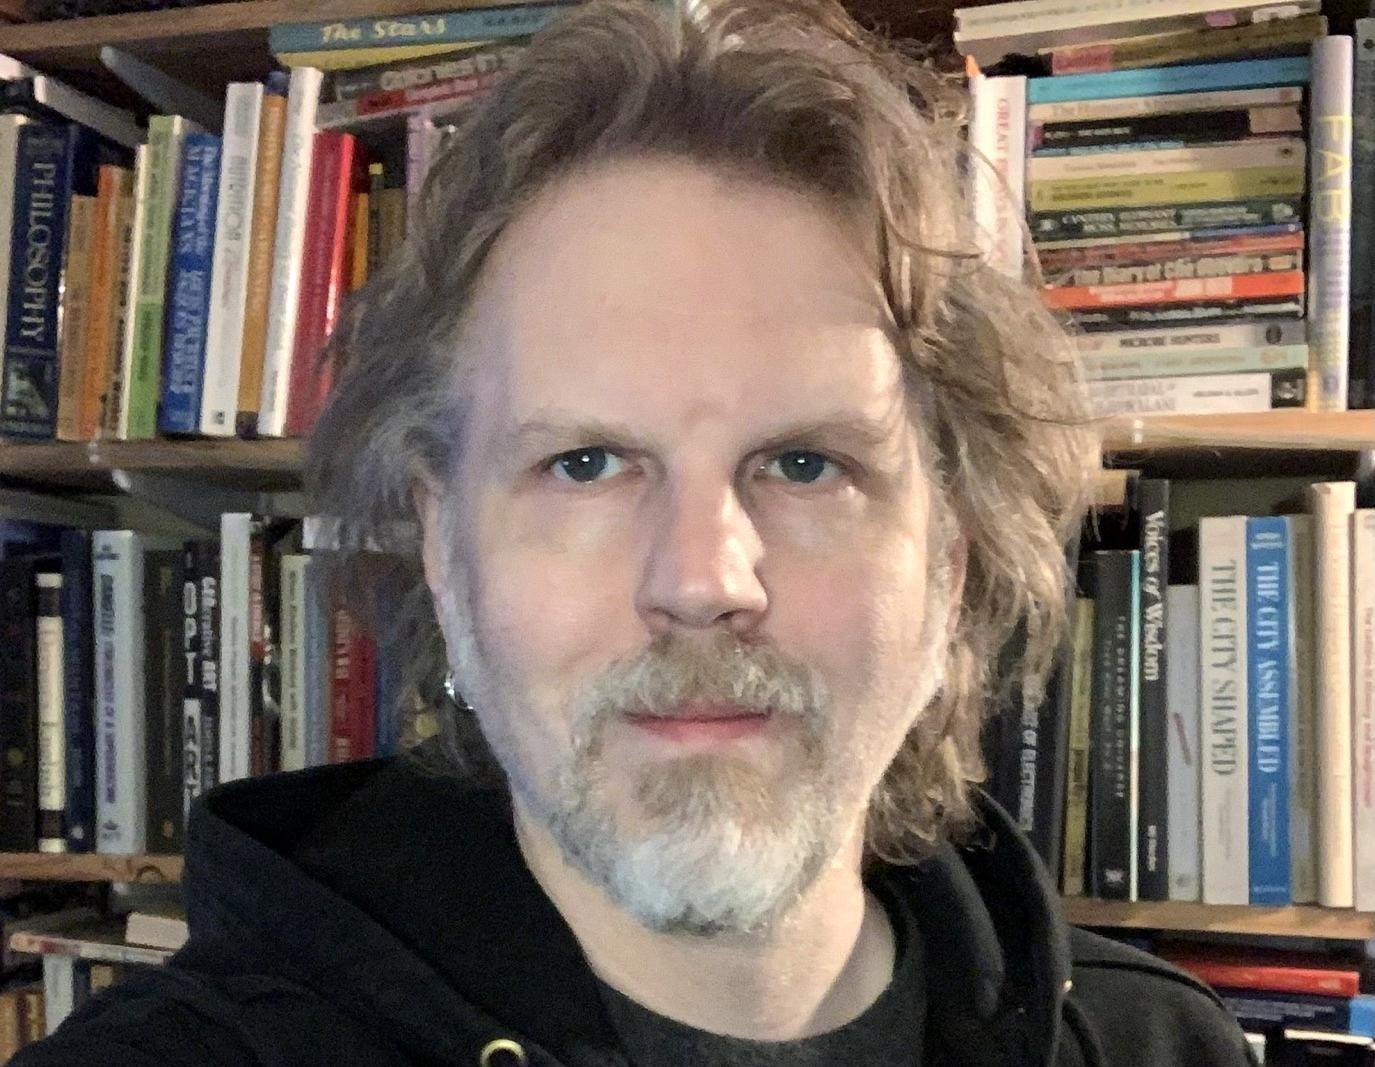
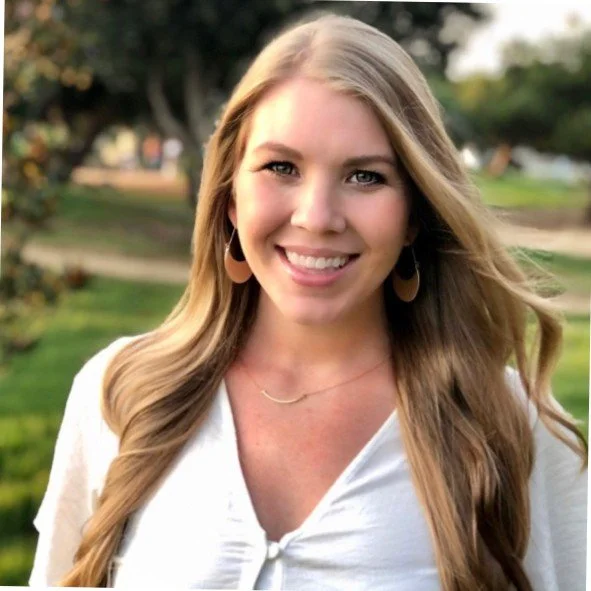
Hey, I’m Steph!
Data Scientist, Statistician, and Person Who Reads the Methods Section for Fun.
I've spent the last decade as the methods person in rooms full of experts helping them figure out what their data can actually tell them. Now, I run Eaneff Data Strategy. I created my company because the best moments of my career have been spent sitting with people who know their field and helping them ask better questions about their data.
Why trust me with your data?
My work has been published in JAMA and BMJ Global Health, and used by organizations including the G20, the White House, the FDA, and UNAIDS. I’ve taught statistics and data science at UC Berkeley, Carnegie Mellon, and Georgetown.
“While her technical knowledge is unmatched, Steph has a unique ability to teach and explain complex data in a way that anyone can grasp.”
Kate Martin
Senior Director of Clinical Development
Cognito Therapeutics

My Process
80% of the work is getting the question right.
Here’s how I help you find it and turn it into a plain-language, actionable finding.

Audience
Who needs the information, and what will they do with it? Every engagement starts with understanding what we’re trying to accomplish, and why, before anyone touches the data.

Data
What data do you already have? Together, we document what exists, identify the gaps, and map out what's possible now and what to plan for next.
Analysis
The bridge between audience and data. I translate what the data tells us into something your audience can understand, explain, and act on.
"Steph's ability to track down data, interrogate it, and turn it into something centralized and accessible is incredible. If you have inherited a mess of data to make sense of, organize, or bring into the present, Steph is who you want on your side."

Kyle Stratis
Founder
Stratis Data Labs
Frequently
Asked
Questions
-
That's most of my clients. The intro call is free and low-pressure. You tell me what's going on, I ask questions, and we work together to figure out whether there's something worth doing. Sometimes the answer is "not yet," and that's fine too.
-
It means I work with your team on a part-time, ongoing basis. I show up to meetings, learn your context, and do the actual work. You get a senior data scientist without the full-time hire.
-
No. Figuring out what data you have, what shape it's in, and what's missing is usually where we start. That's some of the most valuable work I do.
-
Most of my clients work in healthcare, including health tech, digital health, and healthcare policy. If your work touches health data, real-world evidence, or evidence generation, we probably speak the same language.
-
You get dedicated attention from a senior data scientist with over a decade of experience. Not a junior analyst, not a team that rotates every few weeks. I learn your context, I do the work, and I design things your team can actually use after I'm gone.
-
Yes. I've worked across most major data tools and can adapt to your stack. If something needs to change, I'll make a suggestion and help you make the switch.
-
It depends on the work. For ongoing partnerships, I'm usually in your Slack, joining relevant meetings, and delivering work on a regular cadence. For sprints, we agree on a scope and timeline upfront, and I check in as needed. Either way, you'll never wonder what I'm working on.
Say Hello
Let's chat. You'll tell me what's going on, I'll ask some questions, and we'll figure out if there's a mutual fit. No cost, commitment, or sales pitch.